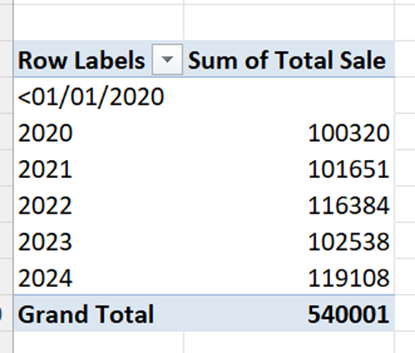
Step-by-step:
Ensure your data has a Date column (like Sale Date) and a Sale Amount column.
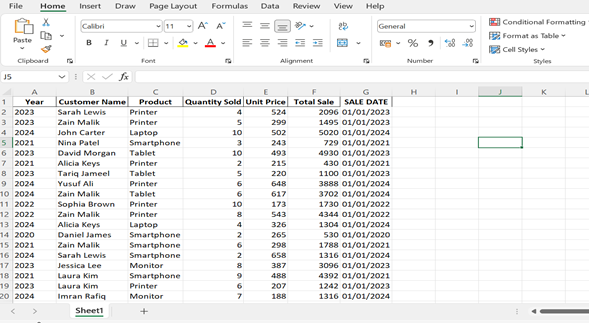
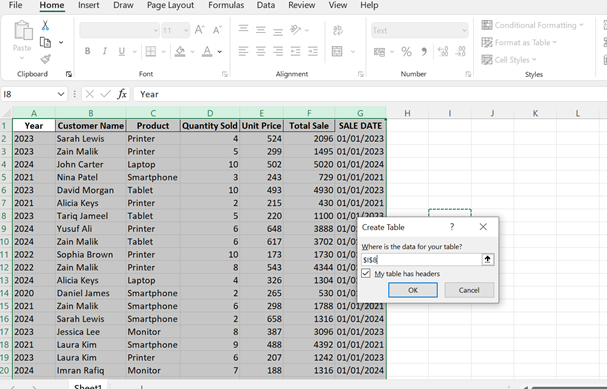
- Select your data → Press Ctrl + T to make it a table (optional but useful).
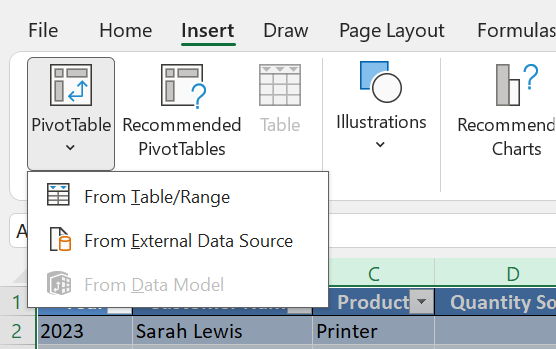
- Go to Insert → Pivot Table.
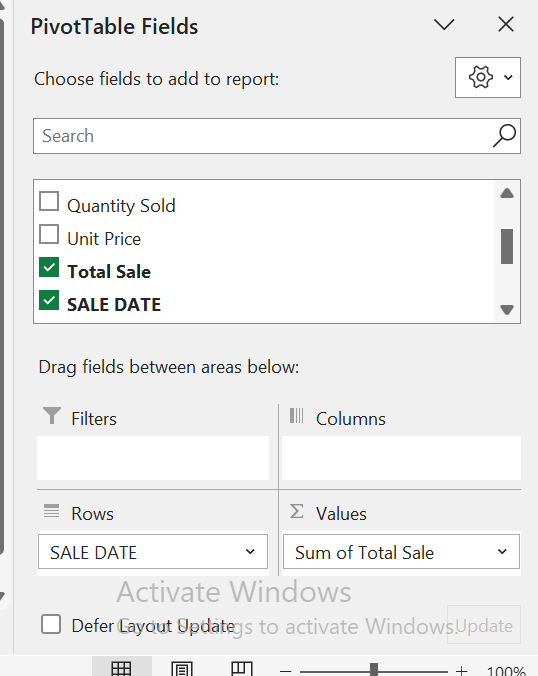
- In the PivotTable Field List:
- Drag Sale Date to Rows.
- Drag Sale Amount to Values.
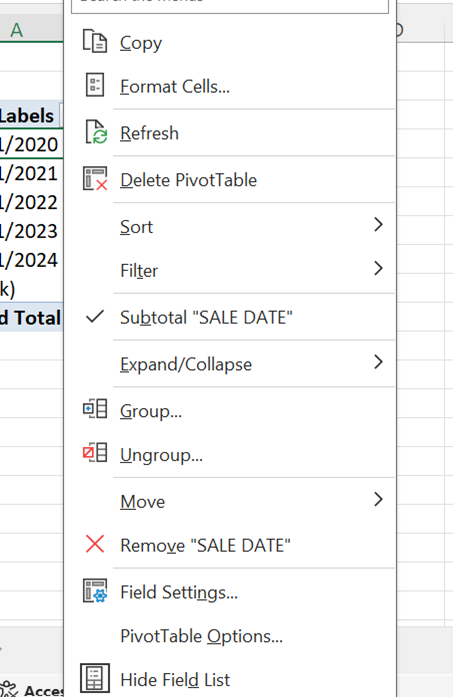
Right-click any date in the row → Click Group → Choose Years (you can also add Months if you want).
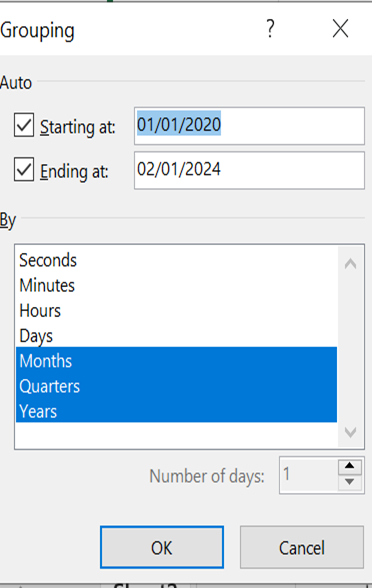
Done — you now have a yearly summary of sales!