When and How to Use a Line Chart in Excel
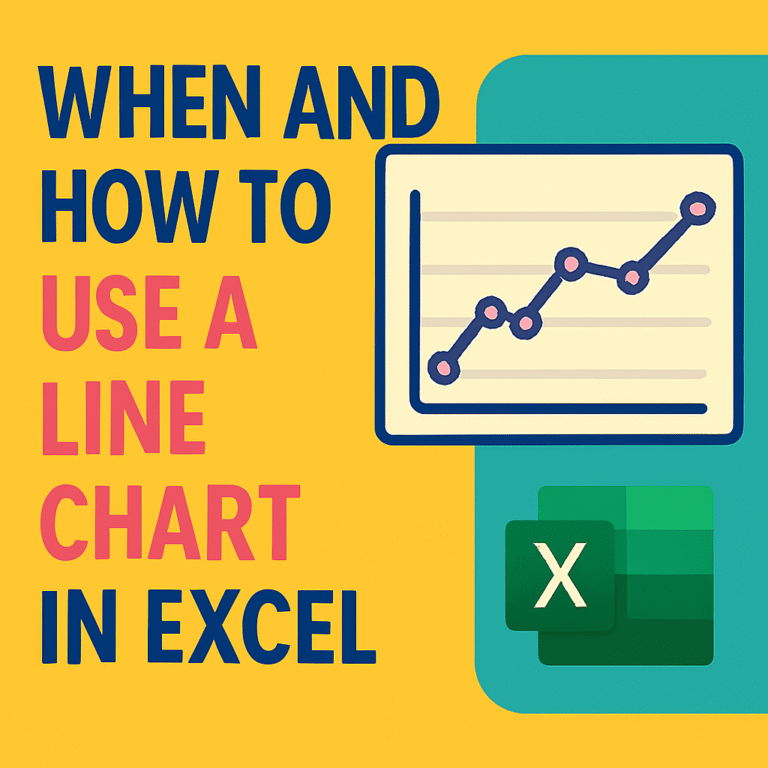
A chart that connects data points with lines to show changes over time · Show trends over time (sales, temperature, traffic). · Compare two or more data sets. · Spot highs and lows in your data. Enter your data in…