
- What is a Line Chart?
A chart that connects data points with lines to show changes over time
- When to Use It
· Show trends over time (sales, temperature, traffic).
· Compare two or more data sets.
· Spot highs and lows in your data.
- How to Make a Line Chart in Excel
Enter your data in two columns (e.g., Month & Sales)
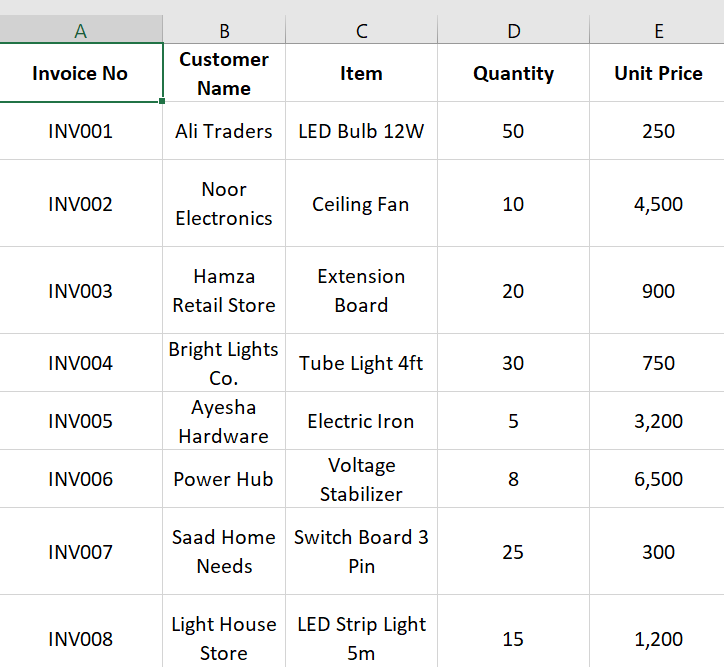
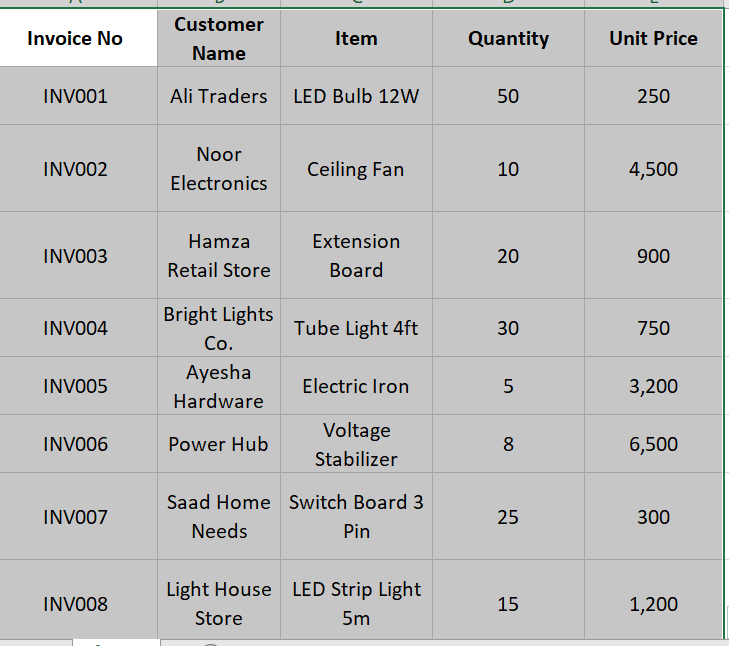
Select the data range
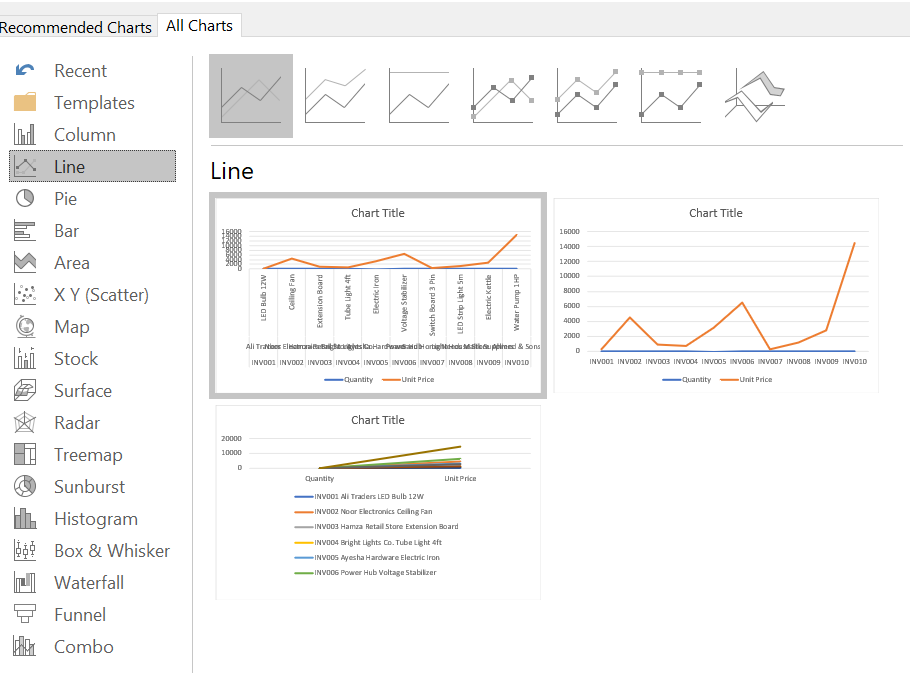
Go to Insert → Line or Area Chart → Line

And then
And here the result is
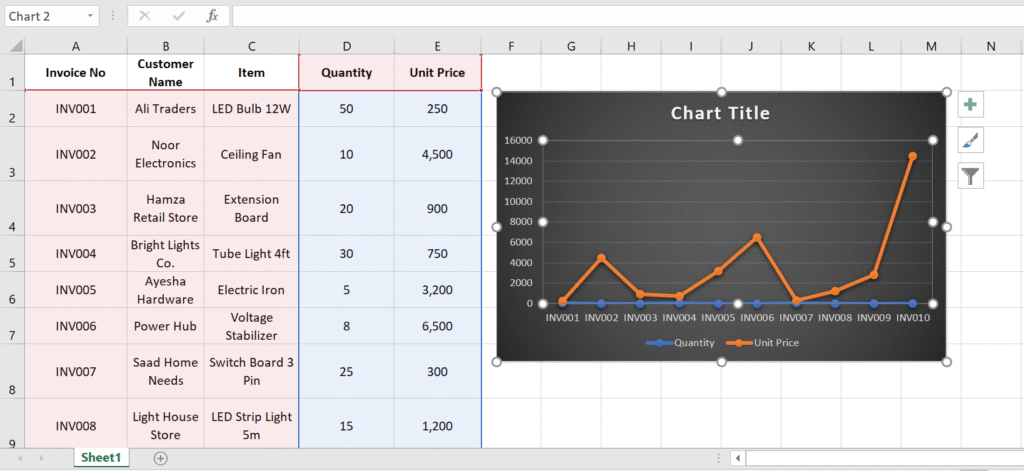
and done