How to open VBA form by keyboard shortcut

In this blog we will be assigning shortcut (CTRL + —)to open our VBA form. So I have form which is opening by button as shown in image. So first let delete the button because we will be opening the…
In this blog we will be assigning shortcut (CTRL + —)to open our VBA form. So I have form which is opening by button as shown in image. So first let delete the button because we will be opening the…
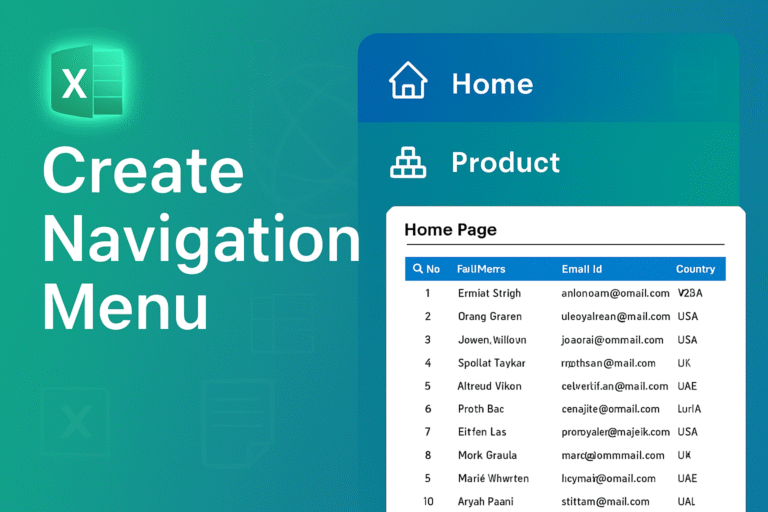
Today we are creating a navigation Menu In excel to make our sheet professionalso let start First you setup your data in your tabsI have four sheets named Insert an shapein the left side area and apply formatting according to…
Today is very interesting and one of the most powerful and easy tool of excel power query a tool by which you can process thousands and millions of data in minutes First Step: Setup your data you want to mergelet…
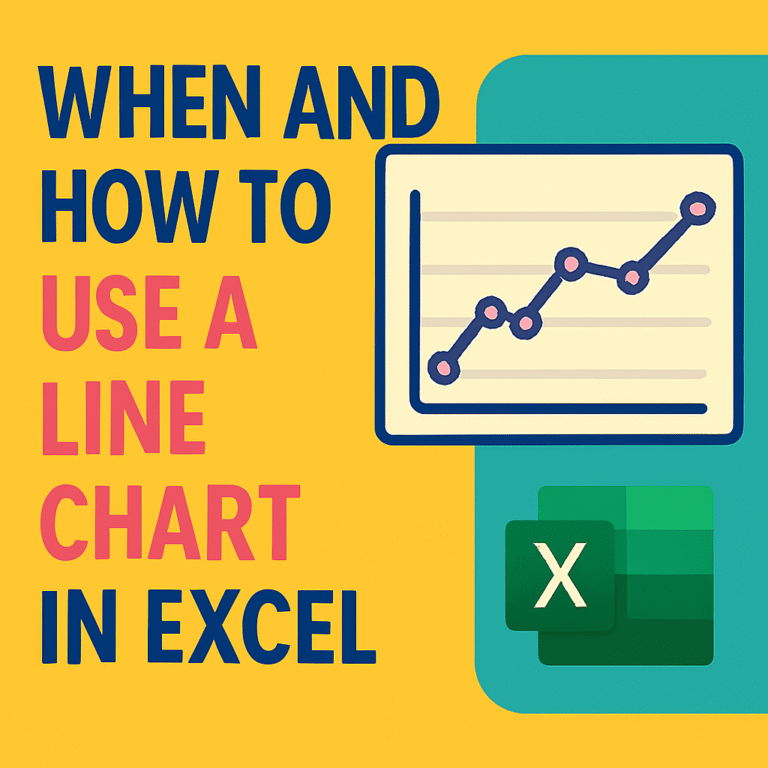
A chart that connects data points with lines to show changes over time · Show trends over time (sales, temperature, traffic). · Compare two or more data sets. · Spot highs and lows in your data. Enter your data in…
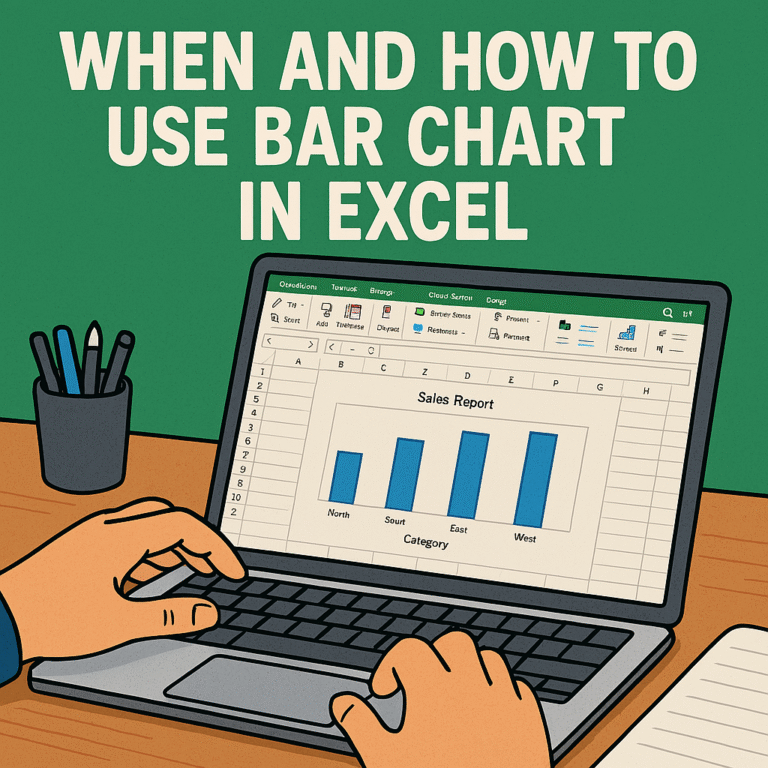
DATA IS GIVEN BELOW Select all data Now I have to go Insert. And go to recommended chart Select all chart and then bar chart Your bar chart has been created. THANK YOU.

Master the Basic Structure: All formulas start with = Example: =SUM(A1:A10) Learn These Essential Formulas First SUM() for Adding Adds numbers AVERAGE() for Calculates mean COUNT() to Counts numeric cells IF() for Simple conditional logic Formula:for example: =IF(B2 > 20000,”Cross”,””)…

HOW TO USE SLICER IN EXCEL The data is given below Now we have to convert this data into table form. Now we have to press Ctrl+T, and this data will be converted into table form.” Press the ok button…
The data is given below Select one row in E coloumn Now we will put the COUNTIF formula in this row Select C2 TO C13 this is the range for the formula. After After that, put a comma and then…
How and when to use the pie chart in excel You have percentage or proportion data. The categories are few (3–7 is best). You want to show at a glance which part is bigger. The data is given below First…
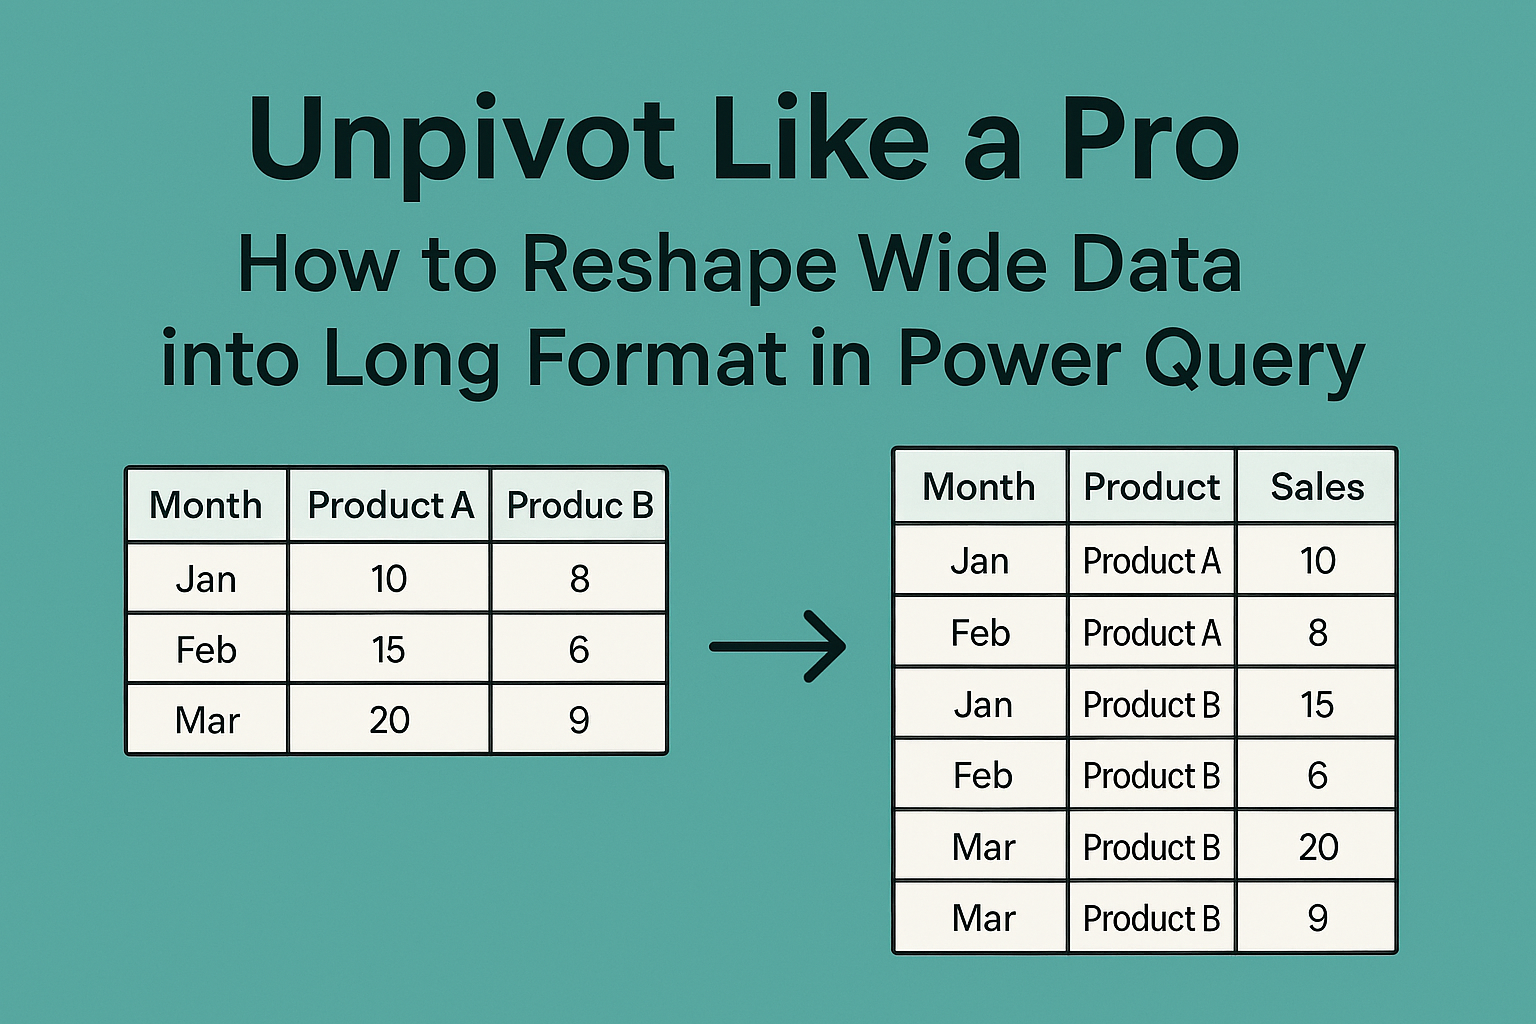
Unpivot Like a Pro: How to Reshape Wide Data into Long Format in Power Query What is Power Query? Power Query is a built-in tool in Excel (and Power BI) designed for data cleaning, transformation, and automation. It eliminates the…