WHEN AND HOW TO USE BAR CHART IN EXCEL
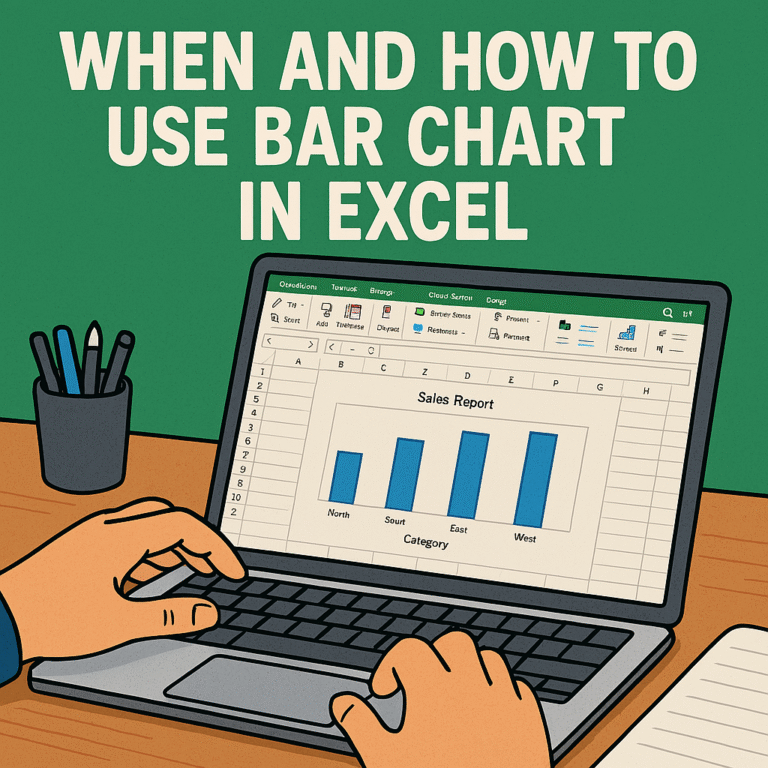
DATA IS GIVEN BELOW Select all data Now I have to go Insert. And go to recommended chart Select all chart and then bar chart Your bar chart has been created. THANK YOU.

DATA IS GIVEN BELOW Select all data Now I have to go Insert. And go to recommended chart Select all chart and then bar chart Your bar chart has been created. THANK YOU.

HOW TO USE SLICER IN EXCEL The data is given below Now we have to convert this data into table form. Now we have to press Ctrl+T, and this data will be converted into table form.” Press the ok button…

The data is given below Select one row in E coloumn Now we will put the COUNTIF formula in this row Select C2 TO C13 this is the range for the formula. After After that, put a comma and then…
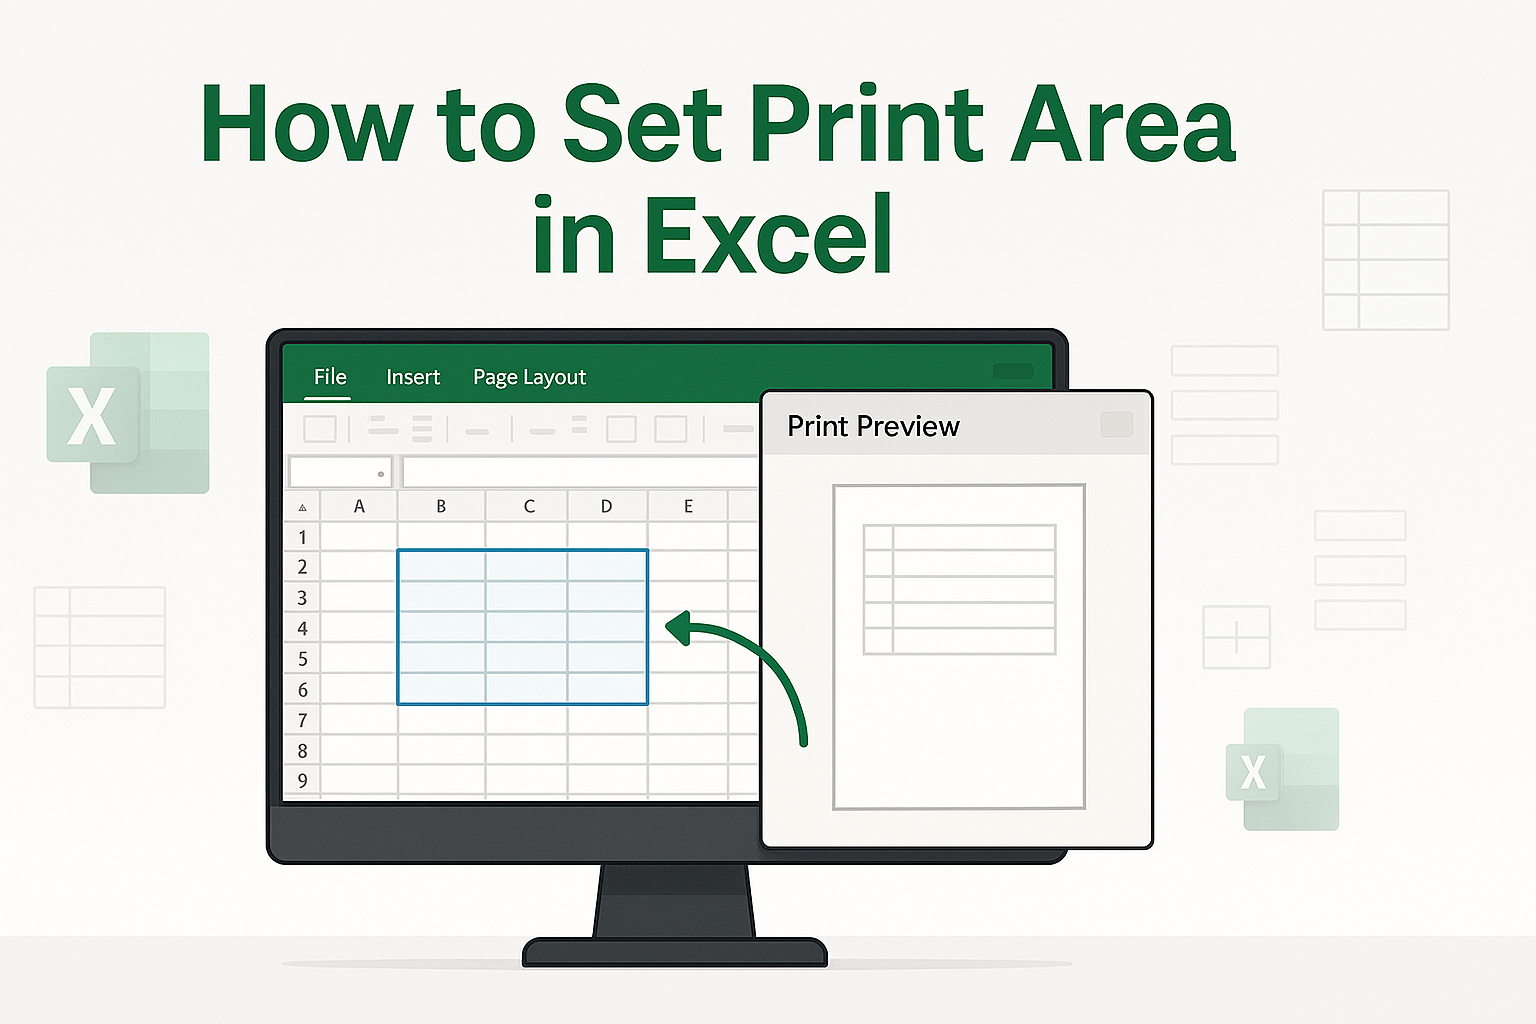
We have This data Below Select all data set. Go to page layout. And now click Print area. And click a Set Print area. That’s it here’s your work. I hope you’ll come again! Thank you.