How and when to use the pie chart in excel
How and when to use the pie chart in excel You have percentage or proportion data. The categories are few (3–7 is best). You want to show at a glance which part is bigger. The data is given below First…

How and when to use the pie chart in excel You have percentage or proportion data. The categories are few (3–7 is best). You want to show at a glance which part is bigger. The data is given below First…
How to remove grid line from excel sheet Look at the data below. In this data, you can see gridlines in the background. We want to remove these gridlines. First, we need to go to the View tab. After going…
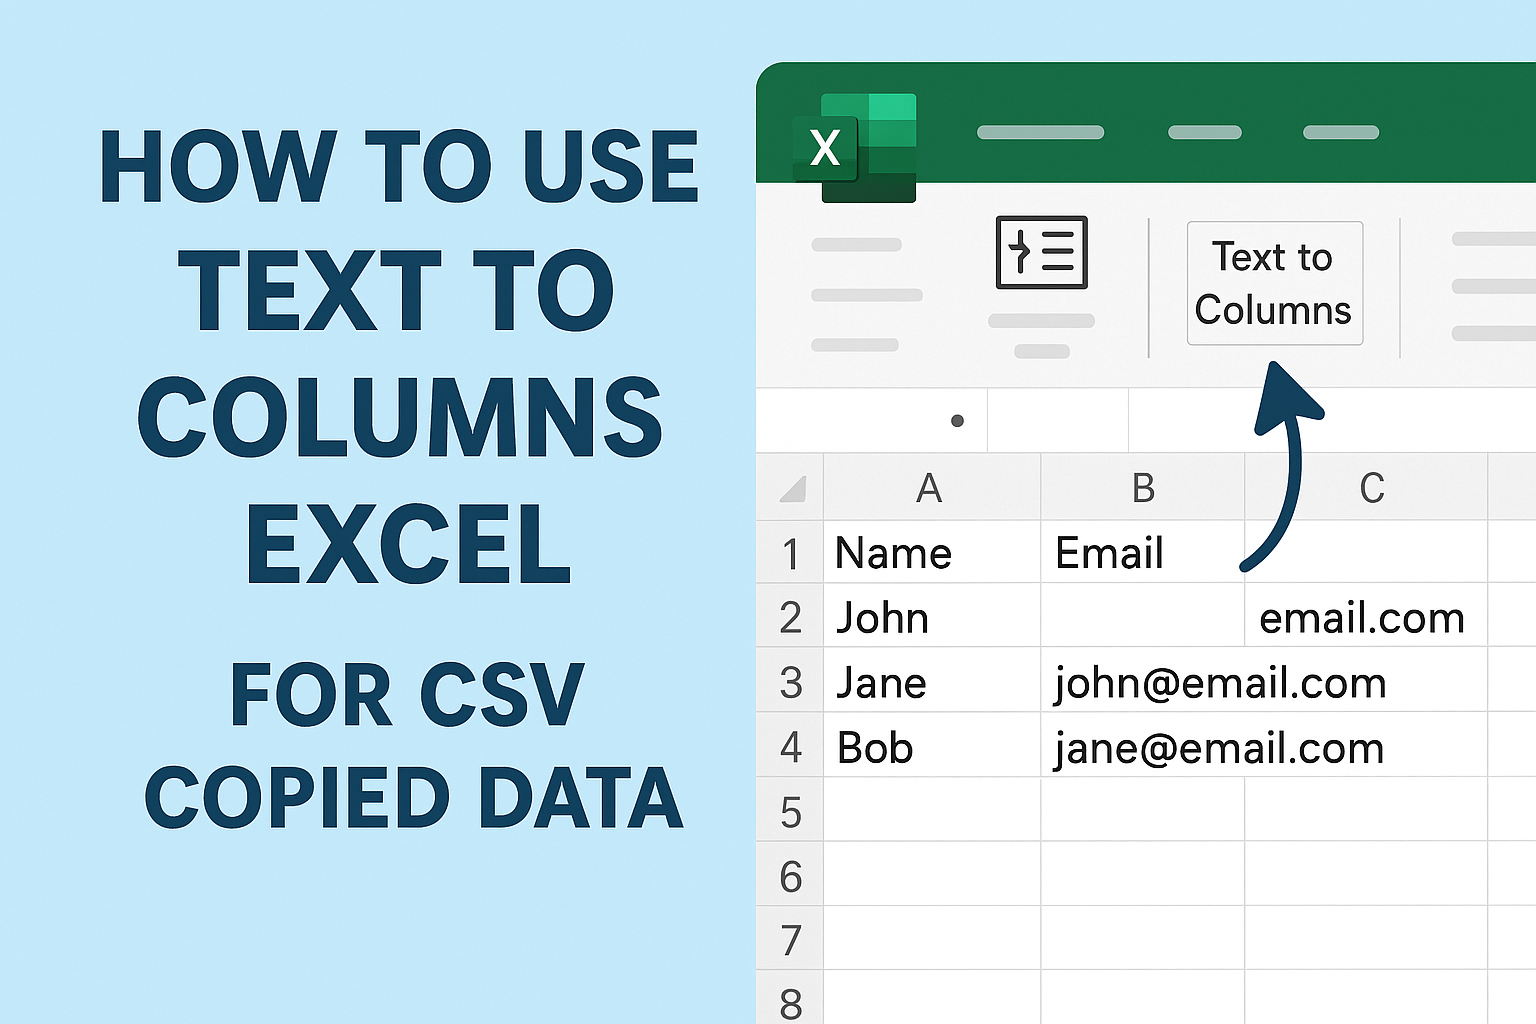
How to use text to column excel feature for CSV copied data. The data is in front of you. This data is now in CSV format. we will organize it into columns. Step 1 First of all, we will select…
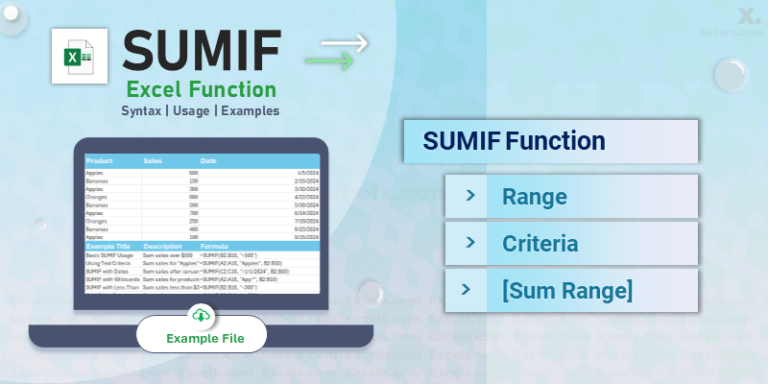
I have sales data, and I’ll show you how to apply the SUMIFS formula on it. I have the data below, please take a look. Type sumifs Formula. And select sum_range And then after that, select Criteria Range 1. Then…
I have the given sales data I’ll show you how we can clean this ten-thousand row data. I have input sale data below I want to clean this data it has duplicates and spelling mistakes I will do it. Steps…