
How and when to use the pie chart in excel
You have percentage or proportion data.
The categories are few (3–7 is best).
You want to show at a glance which part is bigger.
The data is given below
First we have to select the data.
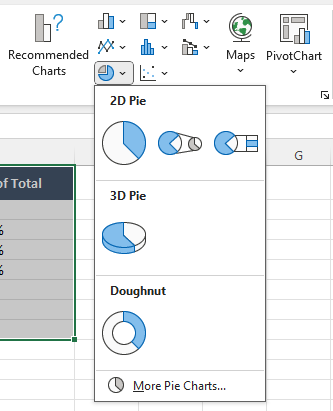
Then we will go to Insert.

After going to Insert go to Charts.
In Charts, we will click on the round one. Next to it, we will click on the arrow, and in 2D Pie, we have to select the first one.
Now the chart is ready, and if you want to change its design, you have to click on the chart. Then, at the top, the design options will appear, and you can select from them.
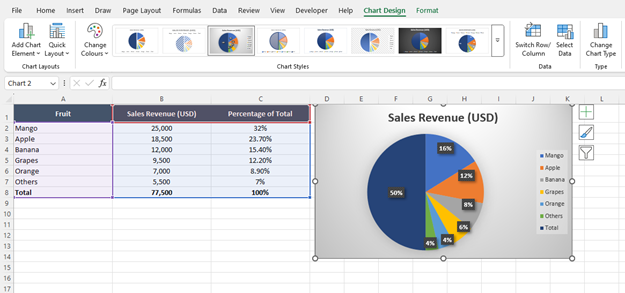
I selected this one, and it’s done.
Thankyou.